

Introduction
Mitra Bio harnesses the power of epigenetics to revolutionise skin treatment efficacy in clinical trials using non-invasive skin sampling. Our innovative approach leverages DNA methylation analysis, a key indicator of biological aging, inflammation, smoking and UV damage. By mapping the epigenetic landscape of the skin, we offer predictive biomarkers that enable precise therapeutic personalization, ensuring treatments are tailored to the unique makeup of each individual.
DNA methylation is a crucial epigenetic mechanism used by cells to control gene expression. It involves the addition of a methyl group to the DNA molecule, specifically to the fifth carbon atom of cytosine rings in the context of CpG dinucleotides. This modification can change the activity of a DNA segment without changing the sequence. When located in a gene promoter, DNA methylation typically acts to repress gene transcription. In the context of cell populations, CpGs can be predominantly methylated (commonly represented by beta values close to 100%) or unmethylated (beta values close to 0%), reflecting the gene expression status. Beta values are the percentage of the methylated reads recovered from the sequencing event. When intermediate methylation levels, such as 50%, are observed, it can be indicative of a mixed cell population or a dynamic regulatory environment where methylation patterns are changing, for instance, during cell differentiation or in response to environmental factors. Also, heterozygosity might cause a small peak around 50%. These intermediate values may reflect the averaging of signals from a population of cells with different methylation statuses at the same CpG site. To get accurate predictions of the methylation level we aim to sequence all samples at 100X coverage.
To illustrate the robustness and reproducibility of our approach, we present a series of controls and analyses that underscore the precision of our methylation measurements. The following sections detail our findings from both technical and biological replicates, providing evidence of our platform’s capability to discern meaningful biological signals from technical noise.
Utilisation of effective controls for methylation analysis
The beta density plots shown in Figure 1 demonstrate the distribution of methylation levels across four samples, with peaks representing the proportion of CpGs that are fully methylated or unmethylated. The sharp and distinct peaks at the extremes of the beta value range indicates a successful conversion and measurement of the methylation status of these cells, which is expected in stable tissue types. This is a critical factor for reliable biological age prediction.
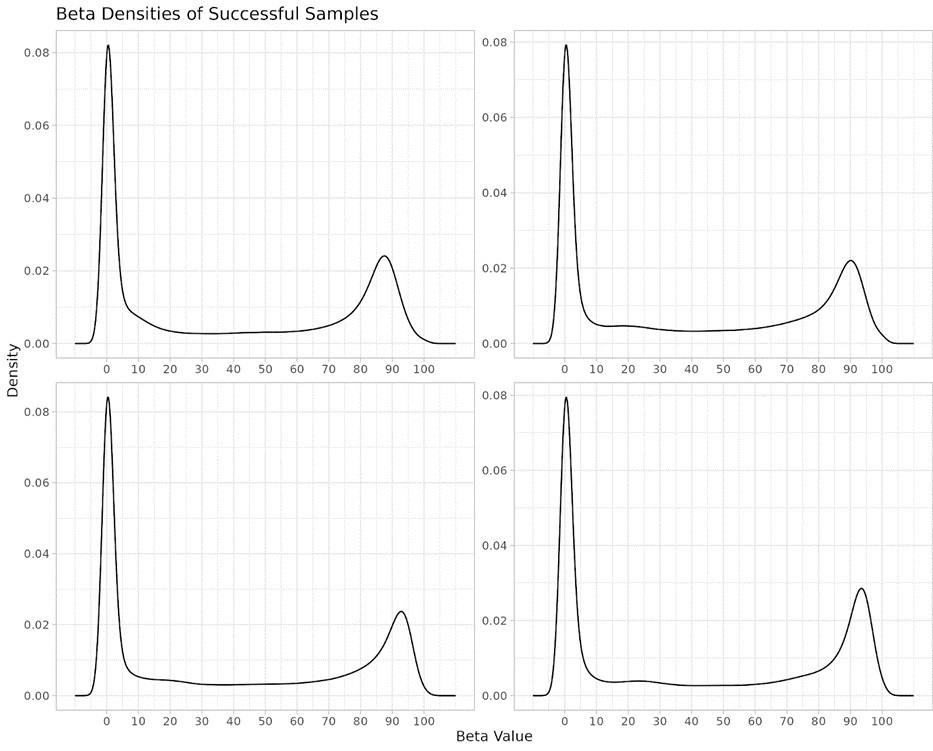
Figure 1: DNA Methylation beta density distribution: pattern for identifying successful samples passing QC. Each graph represents a separate sample, with the sharp peaks corresponding to high concentrations of either methylated or unmethylated CpG sites. The consistent bimodal distribution across samples highlights the reproducibility of methylation status detection in our non-invasive epigenetic assessments.
Tables 1 provide a list of CpG sites that have been consistently identified as methylated or unmethylated across multiple samples. The stability of these methylation states across technical replicates supports the reproducibility of our epigenetic clock and its capacity to generate repeatable data points crucial for longitudinal studies and treatment assessments.
| # | CpG sites with 100% methylation | CpG sites with 0% methylation |
| 1 | chr12:49522598-49522599 | chr1:16644876-16644877 |
| 2 | chr7:81971857-49522599 | chr15:97235406-16644877 |
| 3 | chr9:6495388-49522599 | chr19:927101-16644877 |
| 4 | chrM:4426-16644877 | |
| 5 | chrM:5243-16644877 | |
| 6 | chrM:8855-16644877 | |
| 7 | chrM:11647-16644877 |
Technical Reproducibility
Technical variability in global methylation
Technical reproducibility is essential in epigenetic studies as it validates the consistency, reliability and precision of the assay across multiple runs. In Figure 2, we show three technical replicates of a sample collected non-invasively with the Mitra Bio collection kit. The three replicates have been sequenced in three different events on Novaseq S4 Illumina technology. Figure 2A shows the average beta values of the three replicates. We observe a low standard deviation of 0.0469 across the three technical replicates. This indicates a precise quantification of methylation signals. Figure 2B is a zoom-in in the distribution of beta values of the three replicates. This high degree of precision is critical for distinguishing true biological signals from potential technical variance, thereby reinforcing the integrity of the methylation data. Such stringent reproducibility is indispensable for robust biological interpretations and the development of reliable biomarkers in clinical research.
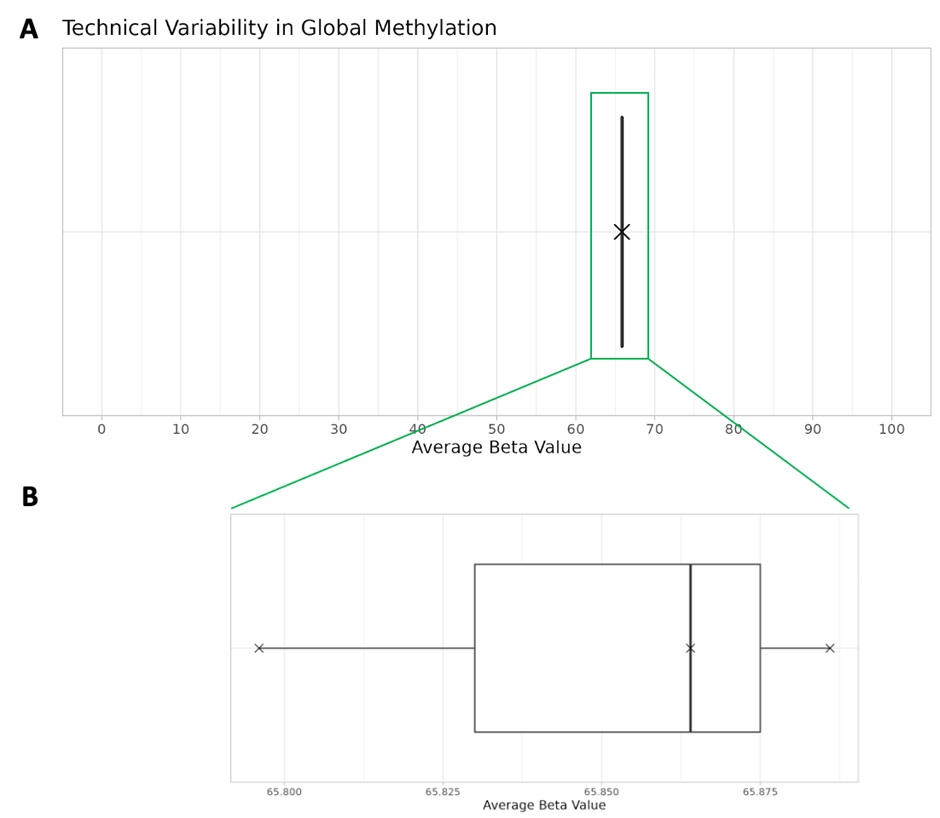
Figure 2: Variability in global methylation. Global methylation quantified by average beta values across three technical replicates. Standard deviation = 0.0469. (A) shows global DNA methylation distribution of the three technical replicates in beta value range 0-100 while (B) zooms-in on the distribution of the three values.
Technical variability in age prediction
Figure 3 demonstrates the technical variability in predicted biological age from DNA methylation data, using three technical replicates. The box plot shows a reproducible age reading, around 47 years with a standard deviation of 2.10 years, indicating a tightly clustered age prediction. The mean absolute error (MAE) of the MitraClock V3 is 3.84 years while median absolute deviation (MAD) is 3.18 years.
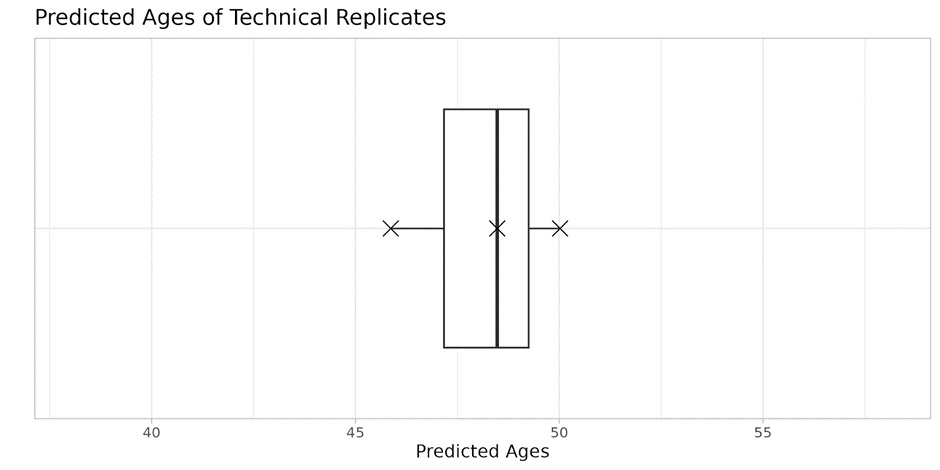
Figure 3: Variability in predicted ages. Predicted ages of three technical replicates. Standard deviation = 2.10
Biological Reproducibility
Global Methylation Variability Across Biological Replicates
In the realm of epigenetic research, biological reproducibility is a cornerstone that validates the authenticity and applicability of data. It distinguishes genuine biological signals from noise, ensuring that the variability observed is an accurate reflection of biological differences or responses to treatment. Figure 4 underlines this principle by presenting global methylation levels across biological replicates from nine individuals measured 28 days apart. Sampling was performed on the forehead and there was no intervention used between the two time points. We observe tight clustering indicating high fidelity in our measurements. The data points for each individual cluster tightly, showcasing the reproducibility of our measurements within the biological context. This consistency is vital for confirming that observed variations are due to true biological differences or treatment effects rather than biological variability.
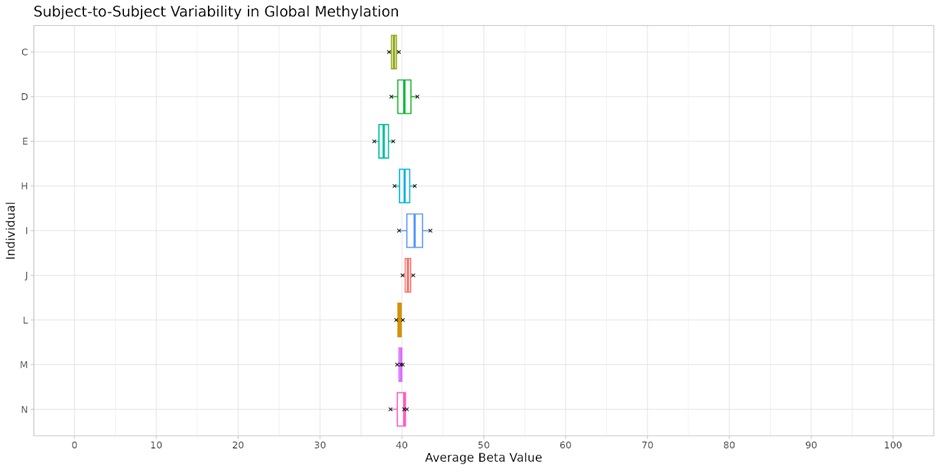
Figure 4: Inter-individual consistency in global DNA methylation. Global methylation quantified by average beta values of biological replicates from nine individuals, measured 28 days apart on the forehead. No intervention has been used. The tight clustering of data points for individuals C, D, E, J, L, M, N, each with two replicates, and individuals H-I with three replicates, indicates good reproducibility within individual methylation profiles. The minimal variance between replicates underscores the reliability of our methylation assessment methods. Mean standard deviation = 1.35
Differential Methylation Response to Treatment
The heatmap in Figure 5 offers a visualisation of methylation changes in response to topical treatment across individuals C, D, J, L (as shown in Figure 4), with each row representing a CpG site and each column an individual sample. The colour gradient signifies the degree of change in methylation (M-values) from baseline to post-treatment, providing a clear picture of the epigenetic impact of the treatment and the concordance of these changes among different individuals.
“M values” are the logit transformations of the beta values, which are the ratios of the number of methylated reads to the overall number of supporting reads (Sum of methylated and unmethylated reads). M values are calculated using the formula:
This transformation is used because M values are more statistically valid for the differential analysis of methylation levels, providing better normalisation and variance stabilisation, especially in the case of large sample sizes. They are particularly useful for identifying significant differences in methylation between samples or groups in studies.
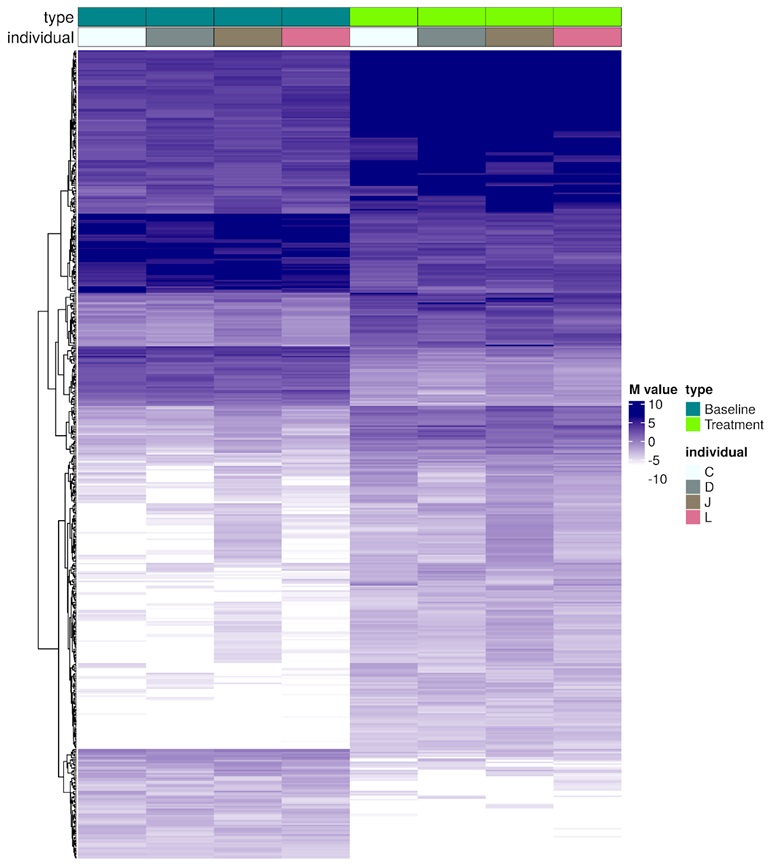
Figure 5: Assessment of epigenetic response to a topical skin treatment across individuals. M-values for specific CpG sites show changes after a topical treatment in individuals C, D, J, L. Darker hues indicate greater deviation from baseline methylation levels, with the consistent pattern across columns suggesting a uniform treatment effect. This concordance signifies the reliability of CpGs as biomarkers for assessing treatment impact.
Concluding statement
In conclusion, Mitra Bio’s approach to epigenetic analysis has been rigorously detailed within this white paper, illustrating our commitment to precision and reliability in DNA methylation measurement. Our use of effective controls, the demonstration of technical and biological reproducibility, and the careful assessment of differential methylation stand as core values in our assessment of sample quality in each project. The findings affirm our platform’s capability to provide actionable insights, paving the way for advancements in non-invasive skin health diagnostics and the broader field of epigenetics.